


Cash Ain't Trash After All
When life gives you lemons, you run to your charts and start drawing arbitrary lines!

Well that was one heck of a way to close the week was it not? Holy moly!
S&P 500 SPY 0.00%↑ down big (-1.4%)
Nasdaq QQQ 0.00%↑ down big (-1.6%)
Oil flat, but 2.5% off its intraday high
Gold GLD 0.00%↑ down 1.2% and off nearly 4% from intraday high
Silver SLV 0.00%↑ down 1.5% and off over 6% from intraday high
These are monster moves and I haven’t even gotten into crypto yet. The crypto market never sleeps so we won’t have daily closing prices for a few more hours but look at this intraday moves so far:

What’s a quick 15% between friends? I’ll get into some of the more crypto-specific stuff in a moment. But first, I want to rip through some of these charts as there is a lot of damage all over the place. First, the S&P 500:
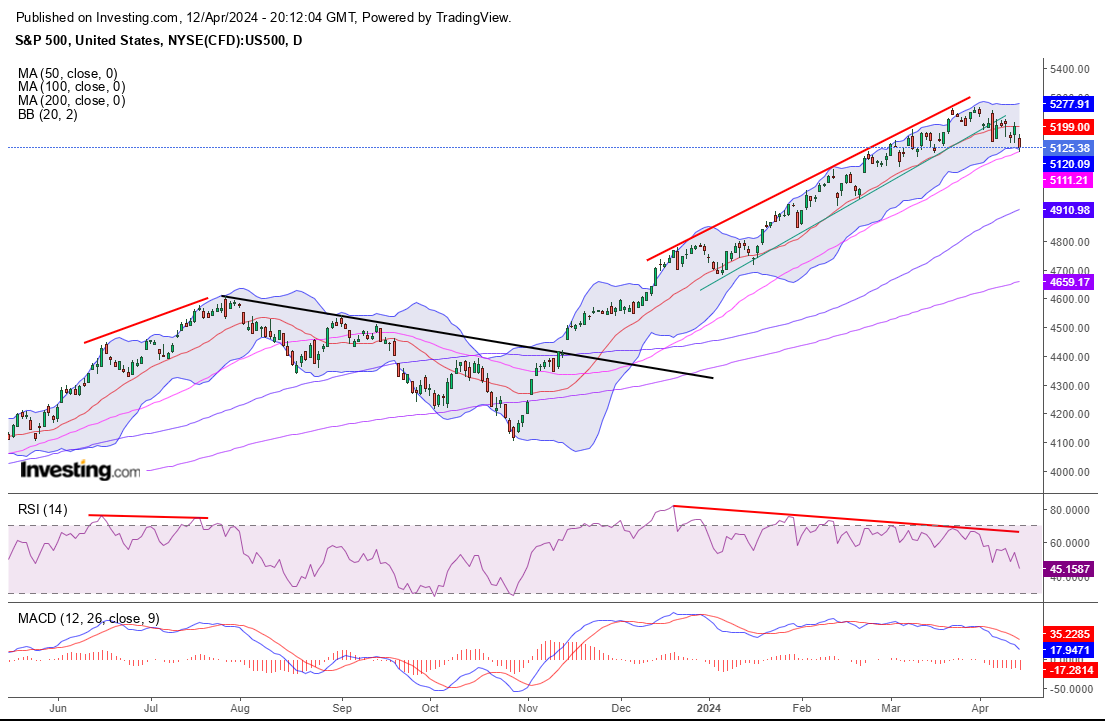
I’ve been mentioning the bearish RSI divergences all over the chart for what feels like months. Perhaps they’re finally starting to matter. Today was the first time the index has made contact with the 50 day MA in about 5 months. Thursday’s back test of the middle Bolli band failed and the market closed just off the lows of the day today. It’s certainly possible this was “the dip,” but I suspect there is more pain to come:

This is my version of Sven Henrich’s chart. He shares it all the time so it isn’t a real secret. The 5 week EMA has been the buy signal going all the way back to October. It finally stopped working this week. IMO the SPX easily shaves another 80 points to test the 14 week EMA. If that doesn’t hold… 🫣
Keep reading with a 7-day free trial
Subscribe to Heretic Speculator to keep reading this post and get 7 days of free access to the full post archives.