


Digital Blue Chips: Seasonality, Correlation, And Capital Flows
August has not generally been a great month for digital asset returns through the years. What insights can we gain from historical trends?

With July nearing an end, we’re officially approaching what has typically been the late “summer doldrums” for Bitcoin and many other digital assets. From a seasonality standpoint, July has historically been one of the better months of the calendar year for BTC price returns. August and September; not so much. In this post, we’ll look back to historical returns for August and September for Bitcoin and Ethereum, analyze correlations between the two, and take a look at the first week of spot ETH ETF investment flows.
Spolier: it’s all very ugly…
Bitcoin
August has historically been one of the worst months of the year for BTC returns. Over the last decade, we observe positive returns in the month just 30% of the time. The same is true for September:

Despite a low aggregate number of positive August returns, the average change is nearly flat. It’s actually September that traders/investors need to probably be mindful of:
August mean change: -0.1%
September mean change: -5.8%
Interestingly, there are some dramatic outliers in this sample. For instance, the best August return for Bitcoin was actually 64.7% back in 2017! The next best August performance was 13.6% in 2021. In each of these instances, the Augusts in the year following Bitcoin halving years have been phenomenal times to own BTC. 2024 is a halving year. Meaning, August 2025 would be another outlier month if history repeats.
Ethereum
Ethereum ($ETH-USD) doesn’t have halving cycles. Thus, we see a slightly different story.

In 43% of Augusts going back the last several years, we see positive returns in the month. This implies outperformance versus Bitcoin. However, as we’ll soon see, the details matter. ETH’s mean change data is actually quite good for August:
August mean change: 11.1%
September mean change: -11.0%
Again, we see September being generally poor in terms of both mean change and percent of positive months in the sample. I should point out, however, that ETH’s mean return data is benefitting from a massive outlier; Ethereum’s best August ever produced a monstrous 92.3% return - again, this was 2017. So what can we deduce from this?
Correlated Assets
I downloaded ETH & BTC 30 Day Average correlation data from IntoTheBlock and compiled averages by month since 2015:
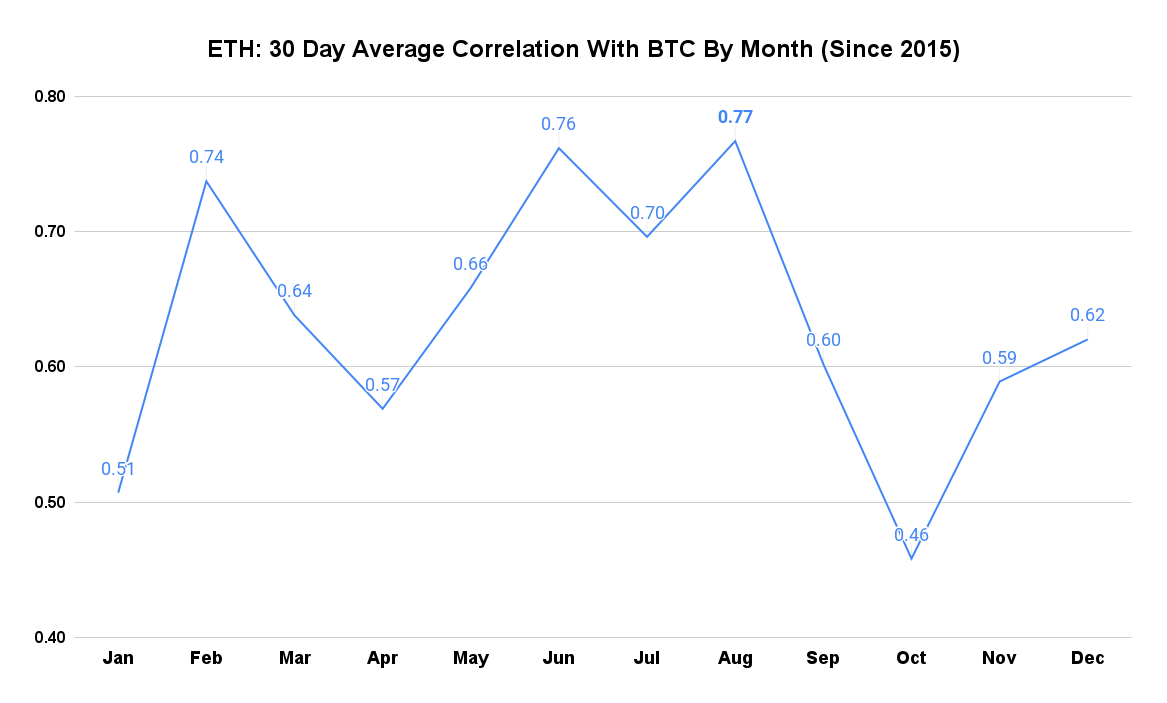
At 77%, August is actually the top month of the year for Ethereum’s correlation with Bitcoin from a price performance standpoint. And it gets even more interesting when breaking August out by year:

The average August correlation over the last 4 years has been a hair over 90%. You can see in the chart that this correlation has actually been tightening up over the last several years. In my view, this shows just how closely ETH has performed with BTC since 2020. I find this interesting because Ethereum and Bitcoin are very different assets.
Fundamental Differences
Beyond just the difference in the consensus mechanism - Bitcoin being Proof-of-Work and Ethereum being Proof-of-Stake - the chains themselves are utilized for different purposes. Where Bitcoin is now seen more as a digital substitute for Gold and hoarding is incentivized due to fixed supply, Ethereum has a far more realistic claim on being the ‘money’ of the internet.
ETH is still essentially the driver of the entire decentralized finance market at 59.9% share of roughly $100 billion in Total Value Locked through public blockchains:
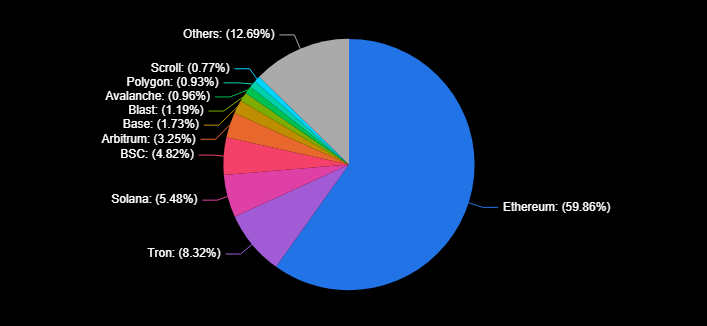
And I’ve made this point before, but when factoring in all of the chains that exist primarily for scaling Ethereum, the ETH ecosystem share of DeFi TVL is actually closer to 70%. There are certainly insurgents to this utility - of which Solana has been making serious strides over the last 12 to 18 months. But for the time being, ETH is a very different animal than BTC. So the fact that they’re so highly correlated is either a concern or an opportunity depending on how one views this space.
What could be driving tight correlations for assets that have historically been very different?
Capital Flows
The correlation between BTC and ETH through the years seems to imply that capital flows ultimately matter more than utility. The Bitcoin ETFs are a huge success story if your primary game is ‘number go up.’ There we’ve seen more than $19 billion in net investment demand since mid-January:
There are now more than 916k BTC held through spot ETF products in the United States alone. This is up nearly 300k BTC on net adjusting for the bloodletting observed in the Grayscale Bitcoin Trust ETF GBTC 0.00%↑ over the last 6 months. However, the story for Ethereum is much less positive after the first week since spot ETH ETFs were approved:

Again we see Grayscale taking it on the chin, this time through outflow from the Grayscale Ethereum Trust ETF ETHE 0.00%↑. A very small portion of the 1.7k ETH that has fled Grayscale’s ETHE fund has made it back to the company’s new mini trust spinoff. And the bigger problem is the other funds haven’t made up the difference either. On net, we’ve actually seen capital investment outflow from ETH since spot ETF approvals last week.
Not good!
Altcoin Seasonality?
For kicks, I wanted to look at some of the seasonality trends for a few of the assets with large market capitalizations relative to most of the cryptocoins in the space. There will perhaps be some eyerolls at these coins. Many of these are considered dinosaur “OG” crypto coins. However, in the interest of keeping as large a sample size as possible for such a fledgling asset class, we’re only going to look at coins that have at least 7 years of price history through TrendSpider. This provides us two boom and bust cycles for each coin.
Another spoiler: they all look very similar to Bitcoin…
Here’s Litecoin:

August mean change: -7.6%
September mean change: -6.7%
Here’s Bitcoin Cash:
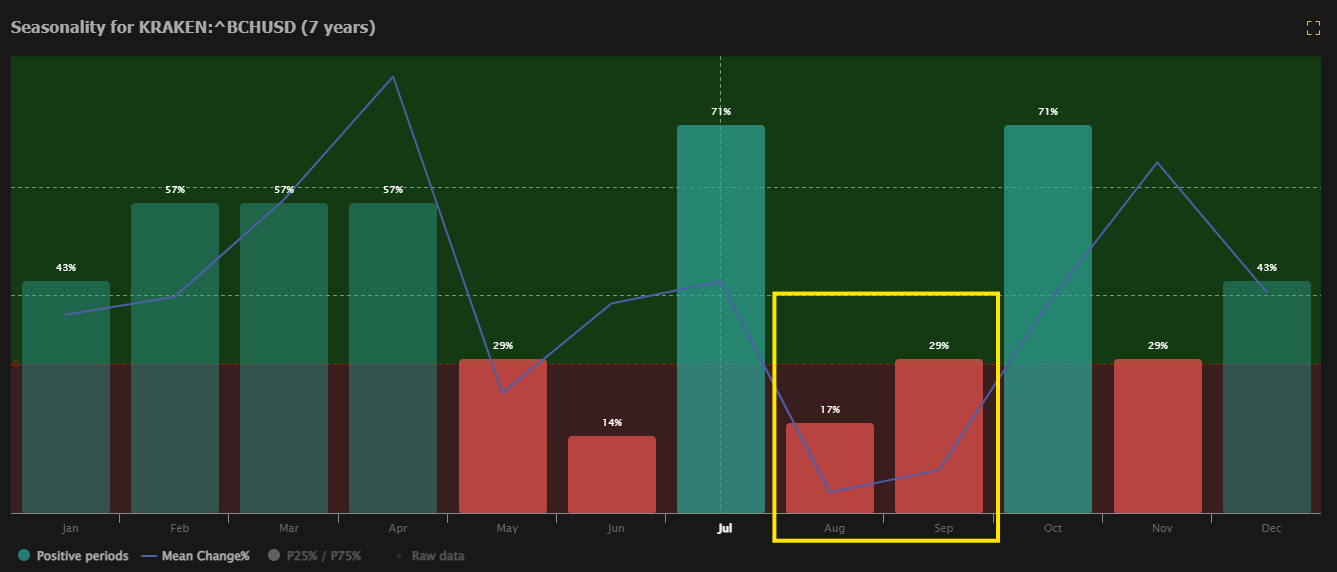
August mean change: -11.9%
September mean change: -9.8%
Here’s Ripple:

August mean change: -7.6%
September mean change: -6.7%
On could perhaps argue that as Bitcoin goes, so too goes the rest of the cryptocurrency market.
Final Takeaways
This is a relatively young asset space. Bitcoin was created just 15 years ago. Most of these things have less than a decade in the market. And it should be mentioned that none of this means things will happen the way they generally have in the past. August has been a bad month for BTC and ETH historically. That doesn’t mean that will be the story in 2024. If you want my opinion, and I like to think that’s why most of you are here, I think the ETFs make all of this much more difficult to model.
One thing that seems fairly clear from a seasonality standpoint is October is a very good month for almost all of these things. I don’t know if that will be true this time around. I suspect the mid-January approvals of spot BTC ETFs pulled forward a lot of what would have been post-halving demand. It’s certainly possible we see August and/or September buck the norms as a result of that major difference.
Ultimately, these things seem to be driven more by investment demand than anything else. Is capital running into this space in an economic environment without stimmies, t-bill rates at 5%, and weakness in stocks? I’m not sure. Perhaps the better question is how long before the money printer is turned back on? If you know the answer to that, you let me know!
Disclaimer: I’m not an investment advisor. I’m long BTC, ETH, LTC, BCH, and SOL.