


Drop It Like It's Hot
Cryptos are selling off as the week comes to a close. Net flows, Correlations, and Altcoins. Oh My!

Looks like we may finally be getting a decent pullback opportunity to close out the week in our cryptocorns of choice. Here’s Bitcoin’s weekly chart at the moment:
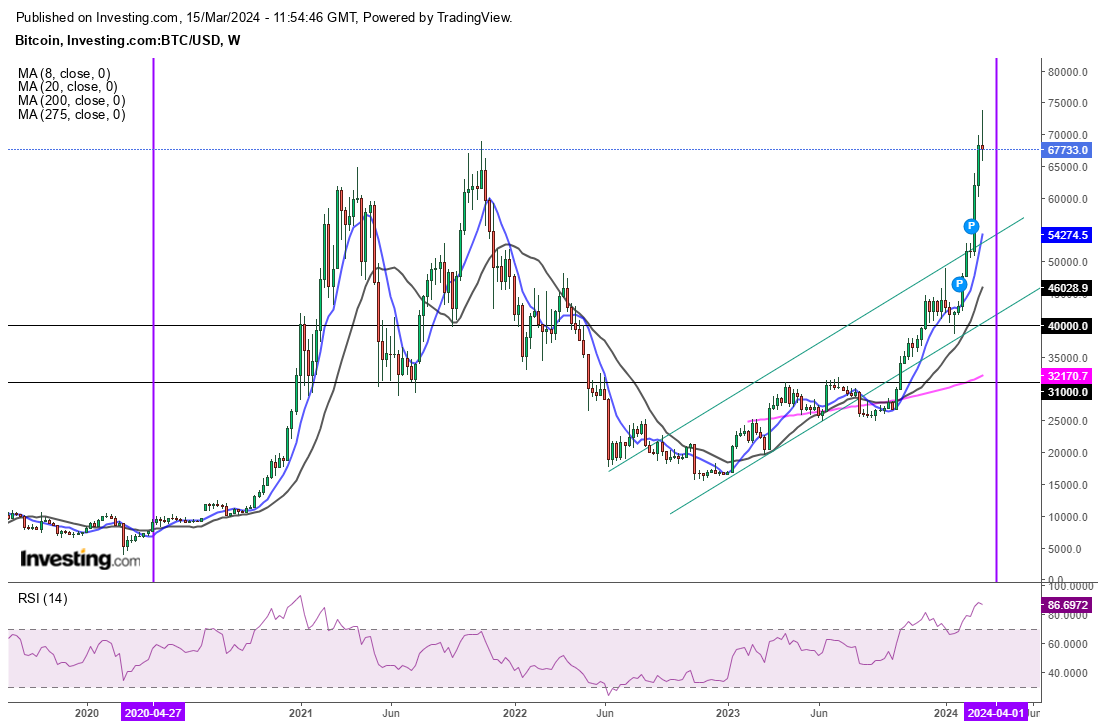
From the high of $73.7k down to 65.7k over these last two days. That’s swift. We're witnessing what is (so far) an 11% peak to trough swing in this week's candle. My approach personally; I really don't want to get aggressive on any buys until we get a bigger drawdown - my hope is for under $60k and a test of the 8 week MA. It may be brief if we even get it all. But currently that puts BTC at slightly under $55k. There is precedent for such a pullback:

It looks small in hindsight, but back in 2021 BTC had a 30% pullback from what was the then ATH of $42k - it tested the 8 week MA and resumed higher. For a strong, sustainable rally post-halving, I think we want to see some of these coins cool off for a bit. That’s just my two... but it does present possible problems in some other areas.
Bitcoin ETF Netflows
I haven’t shared this table with you guys in a while (you can check it out anytime you want here) but the net flow gains in BTC spot products appear to be slowing down. The current net flow is 212k BTC, when I looked yesterday that figure was actually over 214k BTC:

So we may be seeing these ETF buyers selling. The Grayscale Bitcoin ETF GBTC 0.00%↑ outflow isn’t slowing down though. That fund has now seen 38% of its Bitcoin leave management in *checks notes* …two months!

The dollar-denominated flow from Farside shows just $133 million of inflow to these funds yesterday (circled in green). The negative $257 million print in the column directly next to that is GBTC’s outflow. Unfortunately for Grayscale, that does not seem to be slowing down all that much. Looking at the Pearson 30 day correlation with equities and Gold… I mean… c’mon now:

Is it all one trade or what?
BTC Correlation with S&P SPY 0.00%↑: 91
BTC Correlation with Gold GLD 0.00%↑: 84
BTC Correlation with Nasdaq QQQ 0.00%↑: 80
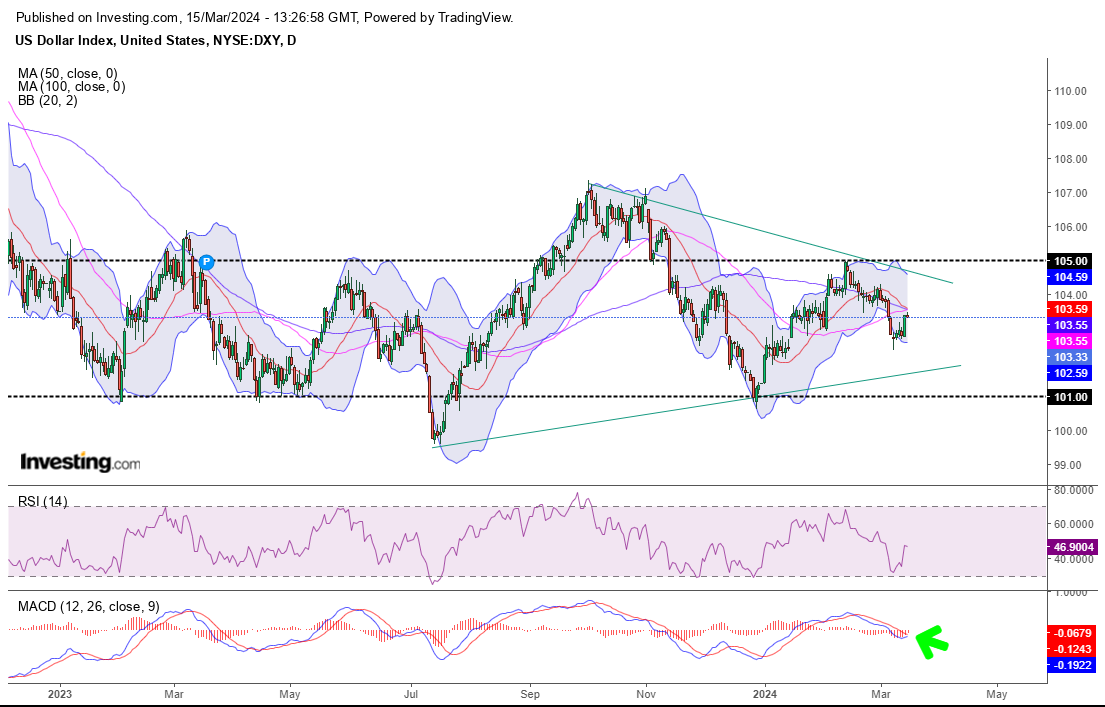
Will the Dollar put up a fight here? I don’t hate this chart. MACD looking ready for a cross. The DXY is still within meaningfully striking distance of its important MAs. All risk assets keep pumping. Let Brent’s milkshake suck begin? We’ll see.
Algorand Is Clinging To The Breakout

My breakout line is $0.285 and the rest of the market seems to agree because that is the level that the bulls and bears have chosen to be the primary battleground so far. In my opinion, it’s all about where the close lands to determine who is really in control. If we see this thing close below $0.285, I may have to reassess the trade as it could be an indication of a fake breakout. I don’t like how some of those indicators look to be totally honest.

Elsewhere, ZEC just had another one of its hilarious 15% intraday meltdowns.
Are you not entertained?
You can’t keep failing to close above $35 everyday for a week straight and expect to keep your shirt on. MACD looks bad. If you’re an accumulator, I think you can wait for sub-$30.
Disclaimer: I’m not an investment advisor. I do risky things that you shouldn’t do.
Sign me up for the drinking game - but I'm old now, so I'll do a sip of beer instead of a shot. Cheers!