


It's The Liquidity, Stupid
While the S&P 500 appears poised to pick a medium term direction, the US Treasury's cash account is at half-decade lows. What could possibly go wrong?

It’s been far too long since I dove in on some broader market happenings here on Heretic Speculator. My general thinking on the index could be summed up this way; I have no idea which direction the S&P is going, but I suspect upside could be fairly limited from here. Believe it or not, when I’m not busy ranting about fiat Ponzi schemes and meme coins mooning, I do try to pay attention to stonks. The S&P chart doesn’t actually look all that bad having defended the 50 day moving average throughout all of April and May:

The 50 is also well ahead of the 200 day MA and both seem to be headed North. Fundamentally, things are a bit less convincing. The almost always phenomenal Lyn Alden spent some time with Kitco at the Bitcoin 2023 conference. During the interview, Lyn spent some time detailing the market implications from the debt ceiling.
I think the whole video is worth a watch but maybe the most interesting thesis pertained to what possibly happens after a debt ceiling agreement is reached. She sees a possible liquidity crunch on the horizon if the US Treasury Department starts rebuilding its cash account with proceeds from new treasury issuance:
Their target is to have about half a trillion dollars in that account at all times. In their preferred environment, that’s what they would do. But in recent months and weeks, they’ve drawn that down to under $100 billion. Which is way below their target because they still have bills to pay but they’re not able to issue debt.
As of last week, the balance Treasury’s cash account was a little under $62 billion. A long time ago that would have been more than enough cash for the Treasury Department to have on hand but since the currency has been thoroughly debased, it’s actually the lowest level of cash holdings since 2017:

Depending on how the Treasury approaches the duration of the debt it issues, a potential consequence of rebuilding the cash position is that it could drain liquidity from other entities like banks. This could potentially put pressure on the broader equity market indirectly. In the chart below, I’ve added the S&P 500 on a secondary axis overlaid with the Treasury’s cash account balance:

My read on this is there is often a bit of an inverse relationship between when the Treasury department is building cash and the performance of the broader market when the cash balance is at the extremes. If the Treasury does indeed opt to raise that balance back above $500 billion, there could theoretically be quite a bit of pressure elsewhere. I’m not smart enough to be able to quantify what that could look like from an S&P drawdown standpoint, but it’s definitely something to consider if you actively manage your portfolio.
A chart that I think is absolutely incredible is the chart of the equity valuations to GDP coupled with the Gold to S&P 500 ratio from Tavi Costa of Crescat Capital:
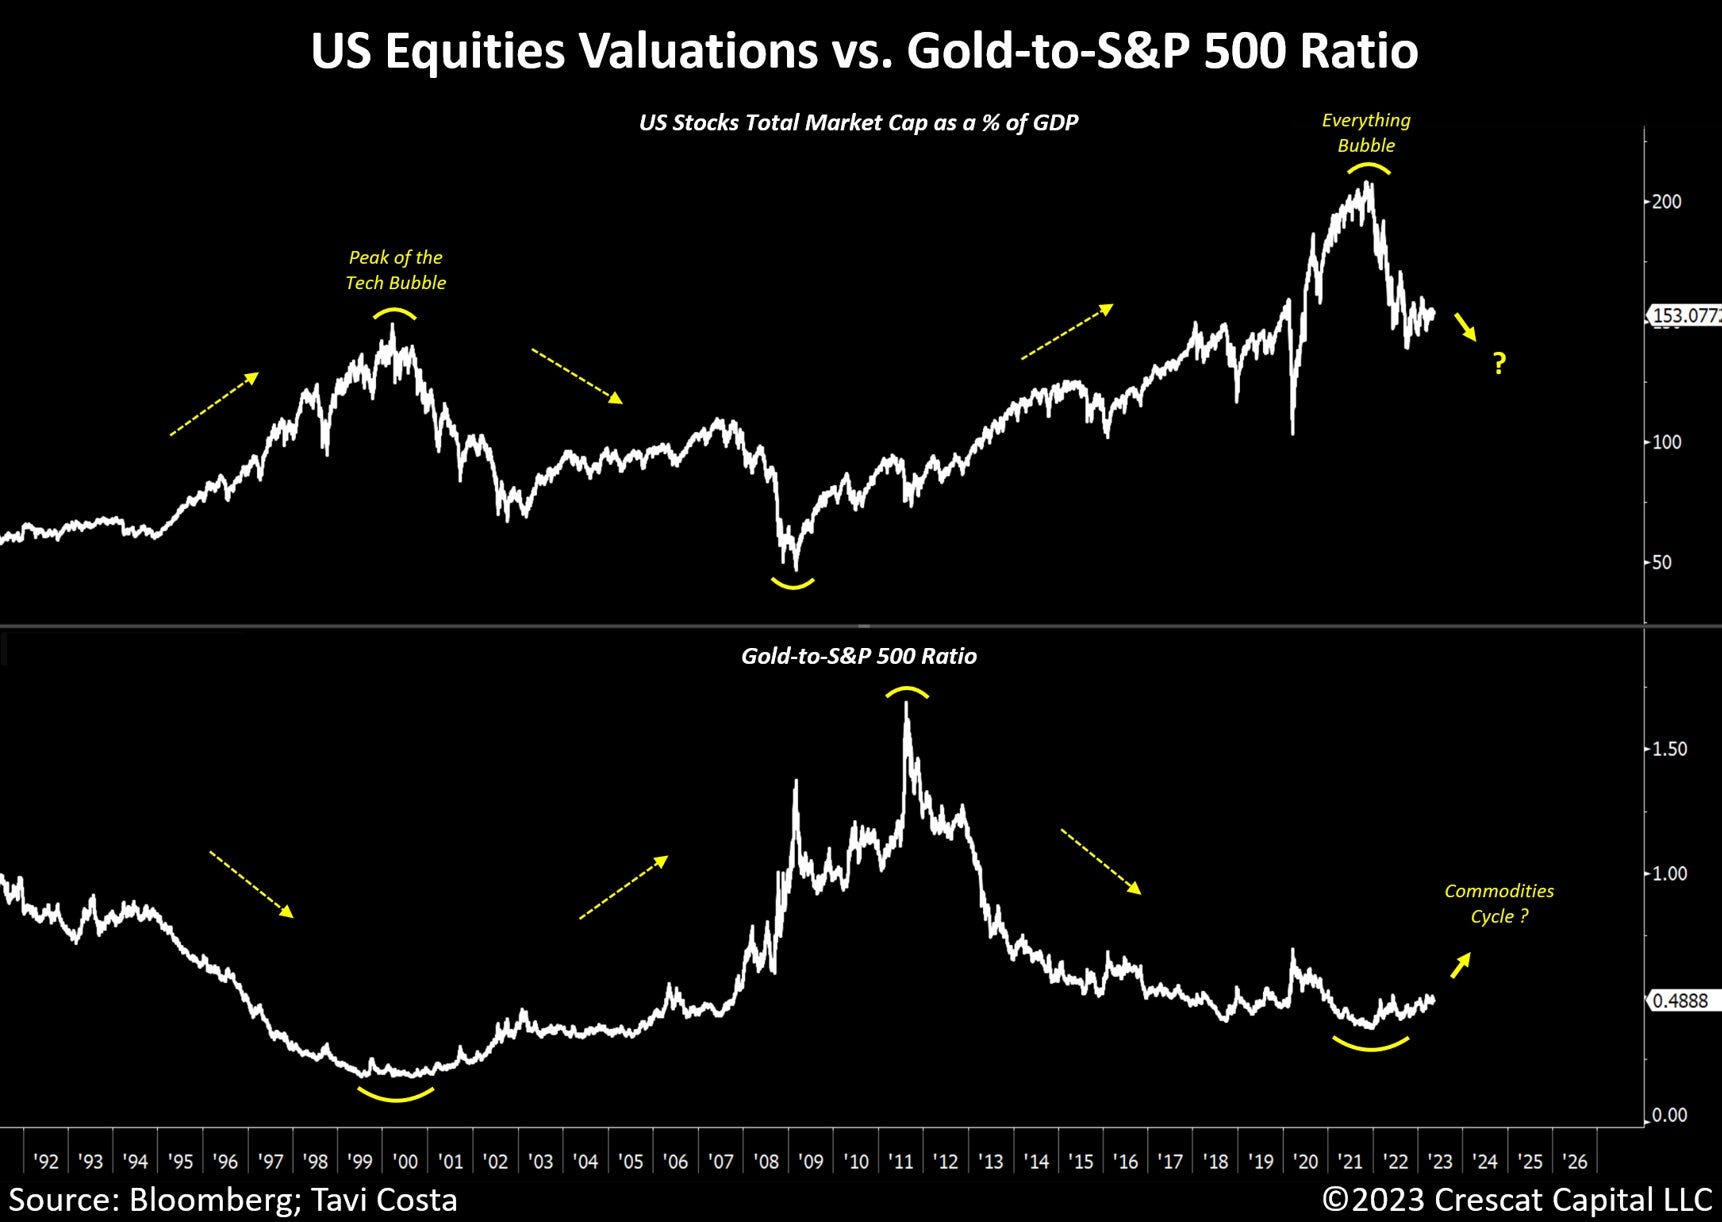
Costa is using this chart to make the case that equity valuations are still at tech bubble era levels while the commodities cycle could be just getting started. You’re not going to get much argument from me that digital assets like NFTs and cryptocurrencies were major beneficiaries of the “everything bubble” that Costa highlights in that chart above.
But now the valuation insanity is coming from things that have any connection whatsoever to Artificial Intelligence no matter how flimsy that connection might be. I detailed how an AI narrative was driving action in Applied Digital APLD 0.00%↑ a couple weeks ago:

But there are numerous companies that are benefitting from AI hype. Herb Greenberg shared a chart today that shows the amount of times “Artificial Intelligence” is showing up in earnings call transcripts. The mentions have absolutely exploded higher:
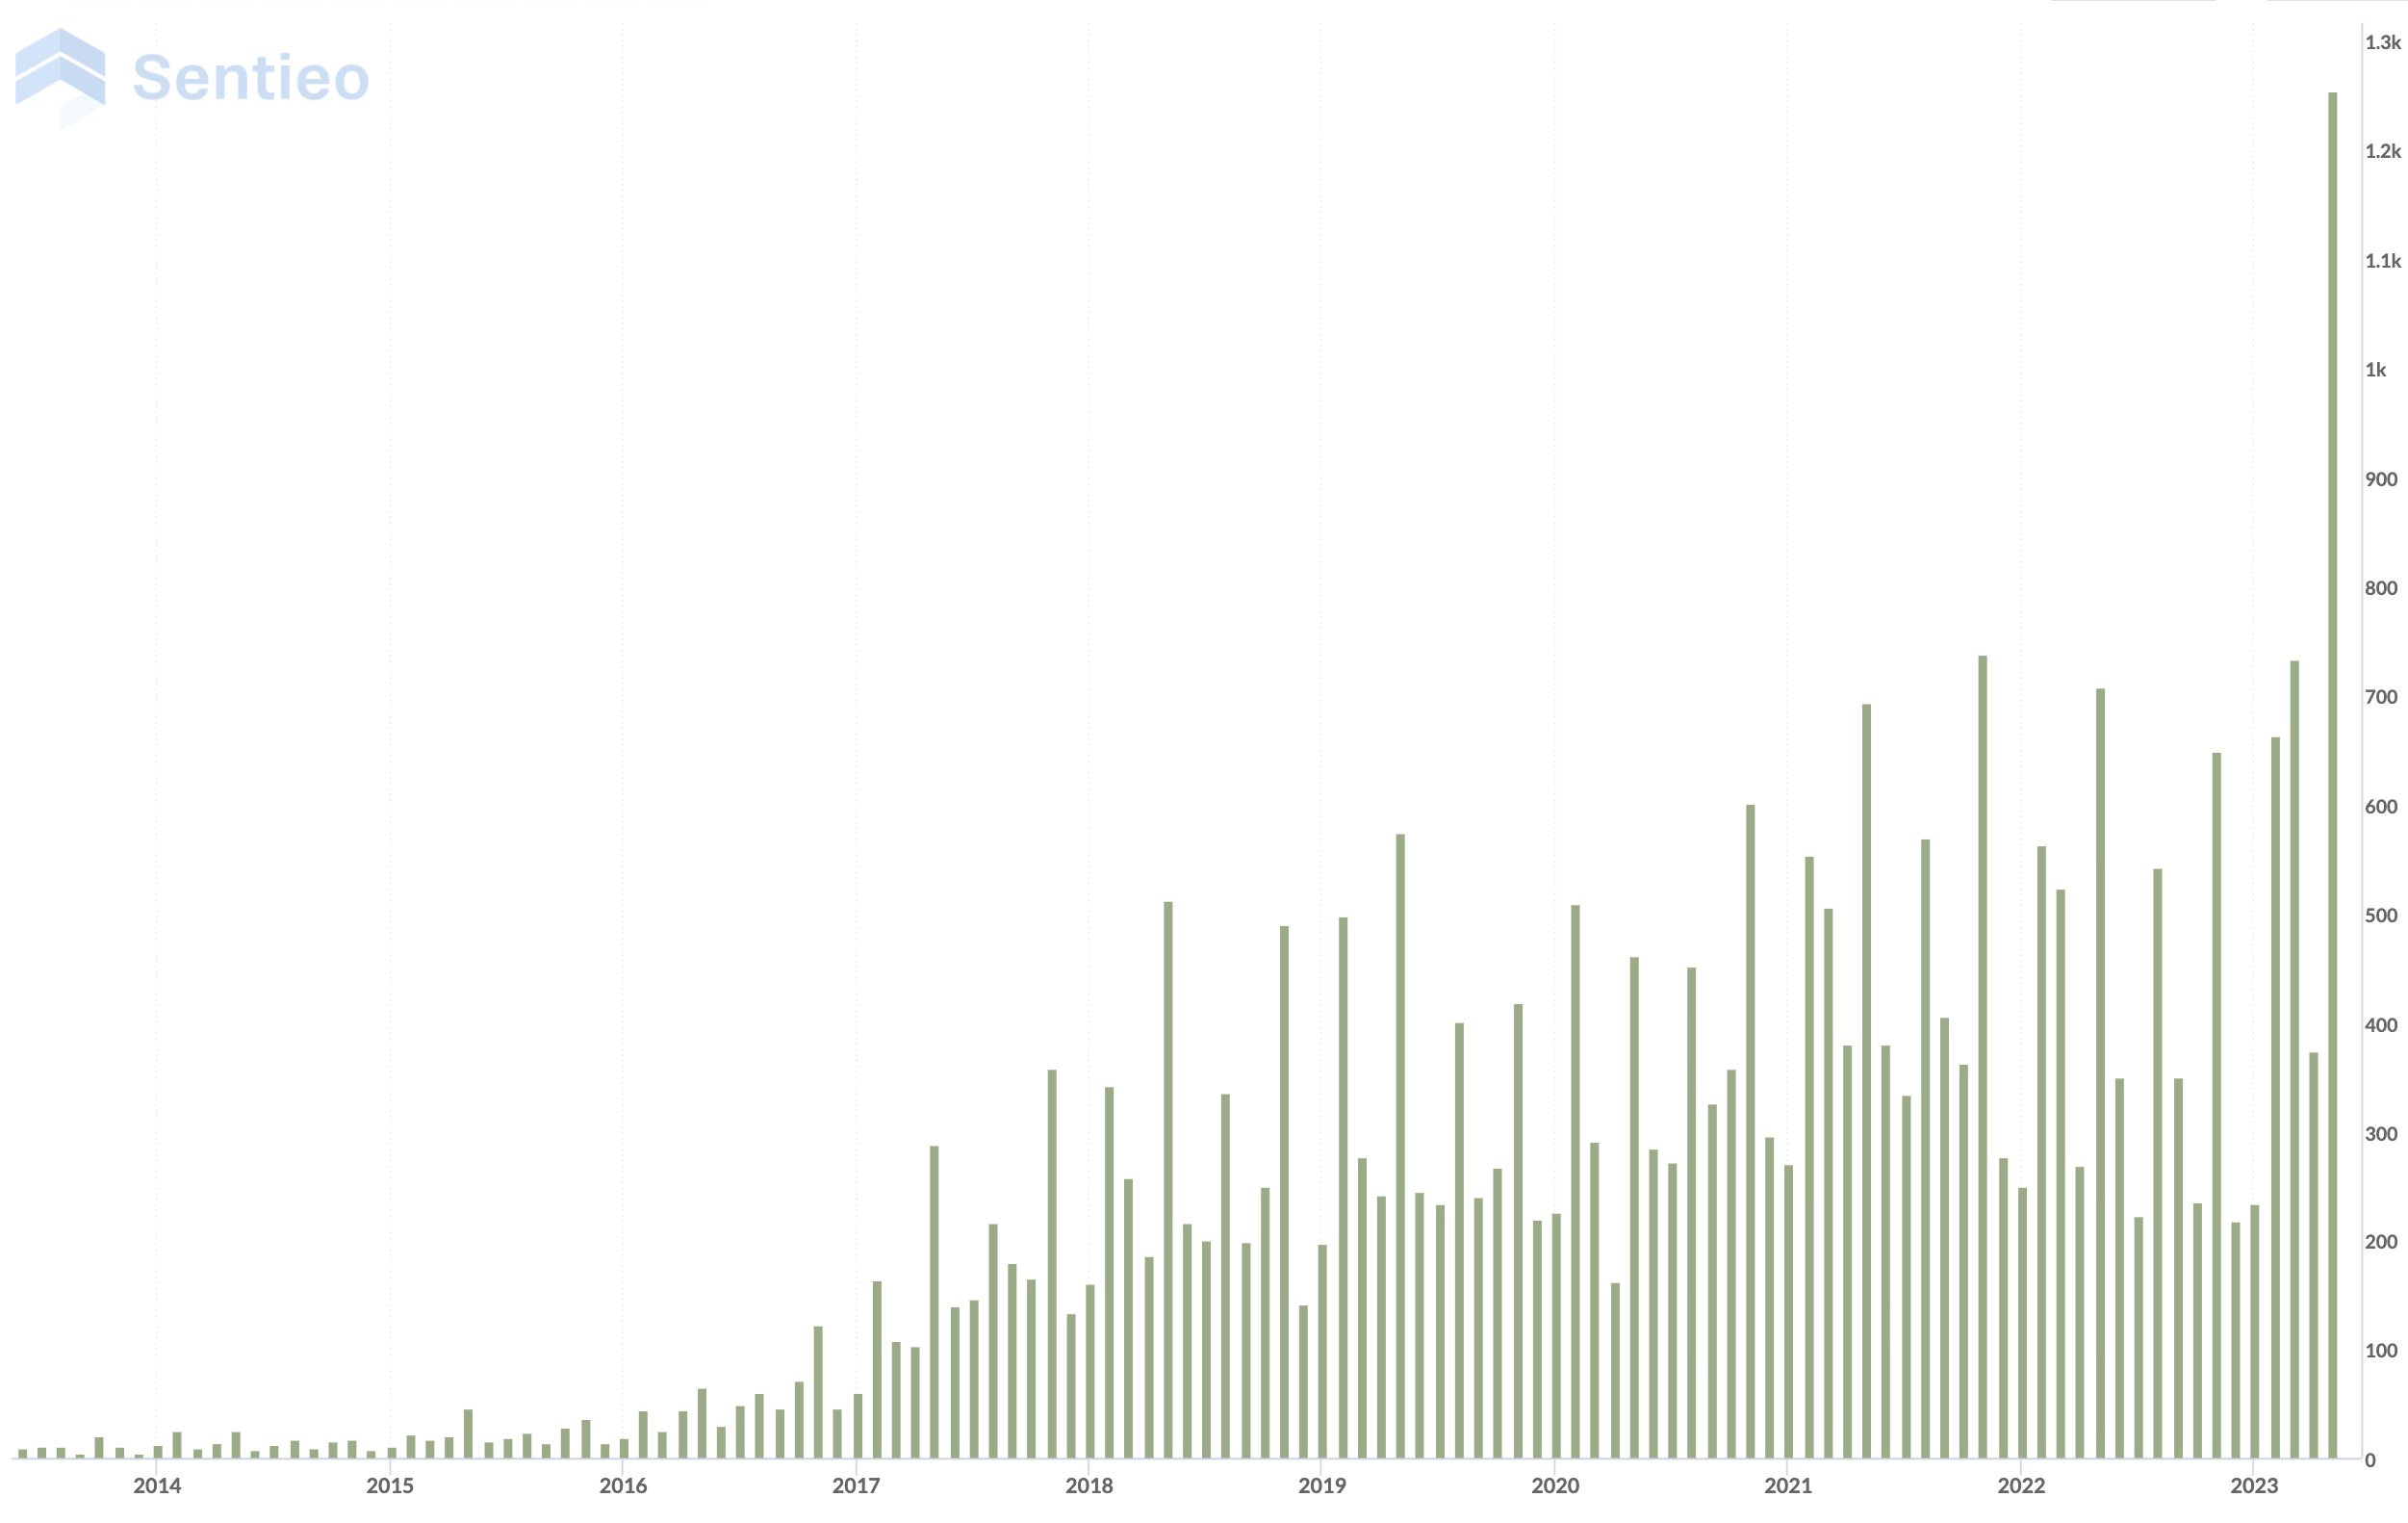
It reminds me a great deal of how publicly traded companies were using “blockchain” as a buzzword to juice returns during the 2017 crypto bull run. The company that owned Long Island Ice Tea changed its name to Long Island Blockchain at the literal top of the 2017 crypto cycle. I’m not making it up. Insanity.
Today, it’s happening all over again. Though this time “blockchain” is “artificial intelligence.” Anecdotally, it’s been a combination of hilarious and depressing seeing some of “Crypto Twitter” creators suddenly morph to AI experts over the last few months. Such is life. With respect to APLD, NVIDIA NVDA 0.00%↑ is probably the poster child for hype valuations during this new AI stock craze.

That company actually could be one that benefits from growth in AI. However, the market appears to have already priced in quite a bit of that growth as NVDA shares are now up 164% year to date. The stock briefly had a $1 trillion market valuation earlier this week. It ends May trading at a 23 times forward sales multiple. It has a P/E ratio of 52! Of course, NVIDIA is part of the Nasdaq and it’s the Nasdaq that is most known for speculative tech stocks.
One final chart to share with you all today…
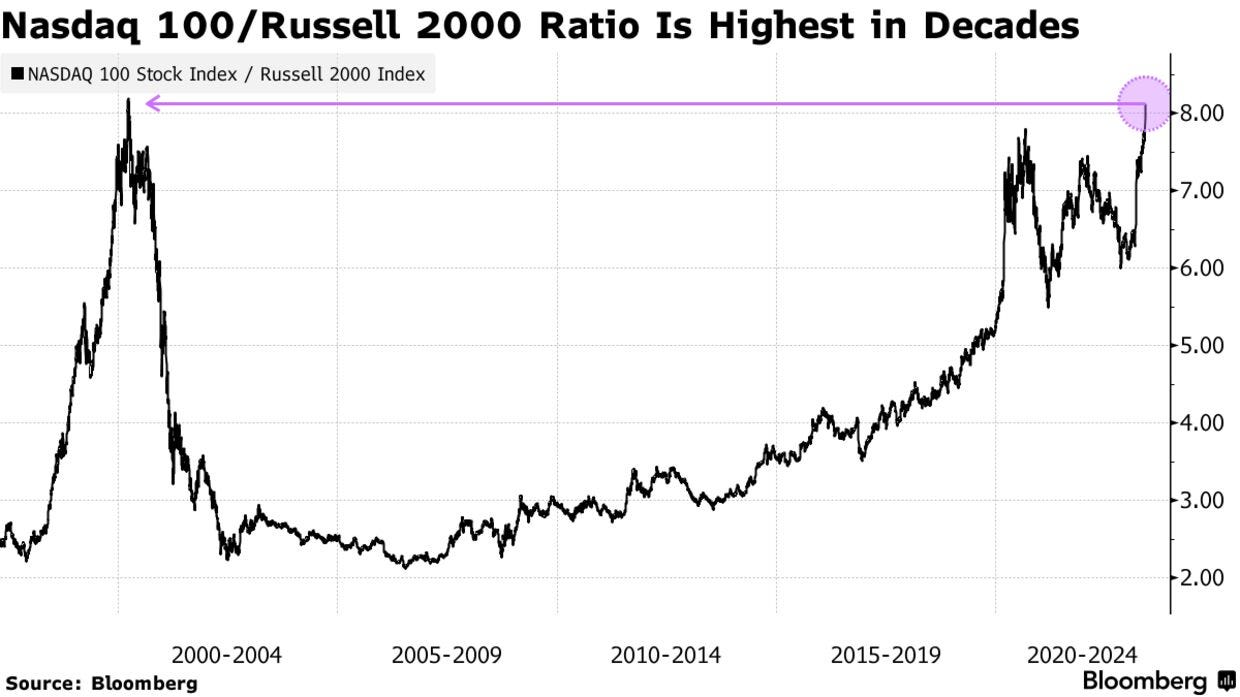
This is the Nasdaq 100 divided by the Russell 2000. Perhaps the Russell is undervalued, or perhaps the Nasdaq is overvalued… maybe it all comes down to the liquidity.

Disclaimer: I’m not an investment advisor.