
Bitcoin Is Testing Key Support
A weekly close below $103k could spell trouble if history is any guide.

Nobody ever went broke taking a profit.
Bitcoin’s chart looks like crap. More than that, the coin is now at a key level that I suspect it must hold to stave off a larger cascade lower. I’ll get into the details in a moment. First, I want to make an important point about rooting interests.
What started as a CIA psyop decentralized anti-fiat experiment for tech weirdos and sound money advocates has officially gone mainstream. Everyone has heard of Bitcoin at this point. There is a broader regulatory apparatus as well as an executive branch that are both supportive of the industry generally speaking. Short of the United States government announcing a literal Bitcoin monetary standard (it won’t), the good news is already in the price, in my estimation.
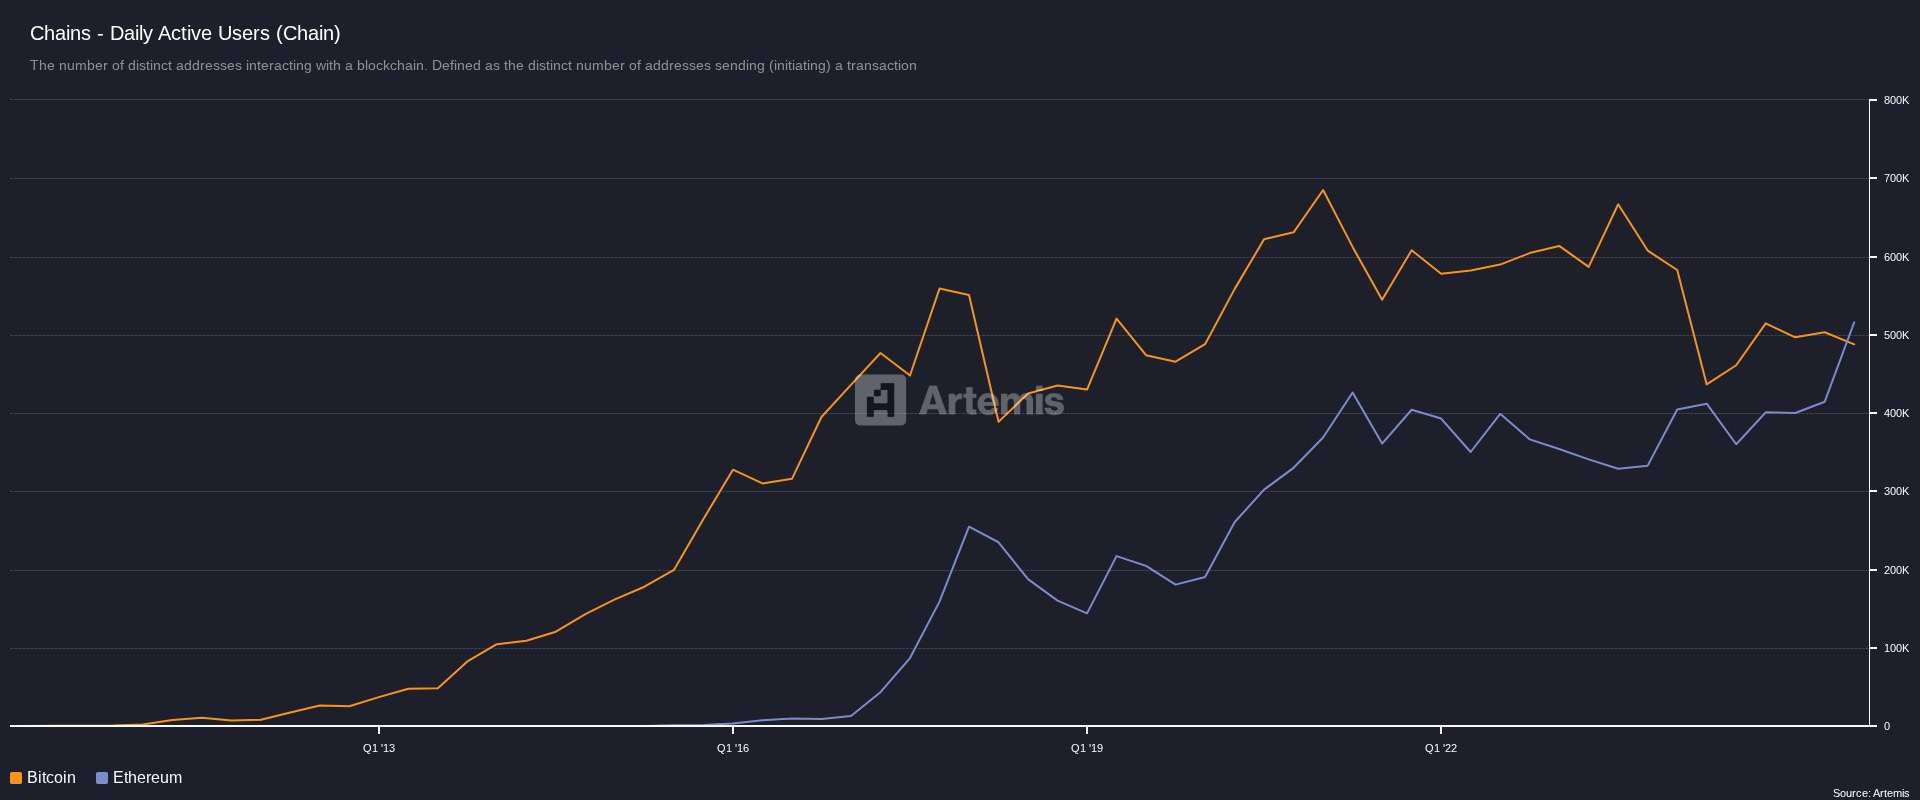
The problem that I’ve been arguing for a while now is that Bitcoin has crypto competition and declining usage - this is not a good recipe.
For better or worse, the traditional ‘big money’ players are actively in the Digital Asset game. Three years ago, we were just hoping to see the approval of spot Bitcoin ETFs. Now we have spot ETFs for Solana that even allow staking. Motivations are not hard here; from the asset managers to the maxi cultists, everyone, and I mean everyone, playing these ponies is in it to make money.
With that established, let’s take it a step further; guys like Larry Fink do not care if Bitcoin goes up or down so long as they get paid from the volatility and the management fees. Thus, the worst thing you could do if you want to swim with sharks is show blood. And the problem for Bitcoin’s number go up prospects if BTC gives up $103,000 is simple; breaking the 50 week MA is showing blood.
More importantly, after a close below the 50 week moving average, the 100 week moving average should historically be in play. And tests of the 100 week MA often foreshadow the same at the 200 week MA. The latter of which is currently below $54,000. Which is well below last cycle’s peak and roughly $21,000 per coin beneath Strategy’s MSTR 0.00%↑ cost basis.
With all that being said, let’s dive into the charts.
Bitcoin Technicals

If you think back to what I said in ‘Leverage, Leverage, Leverage’ in mid-October, I saw the explosive gains in Zcash as awesome yet also concerning. My thinking then was as follows:
there were already signs the crypto market was getting close to a point of exhaustion and one had to look no further than the absolute monster rally that we’ve seen in ZEC over the last couple weeks.
In the past, when Zcash rallies, it has been a major signal that the cycle is mature. Different this time? Meh. Surely ZEC’s rally is due to a genuine, broad shift in consumer demand for financial privacy rather than crypto bros looking under every couch cushion for a left-for-dead asset to pump near the end of a cycle.

Alright, I’ll stop being sarcastic. Here are the BTC charts though if you’re brave enough to look at them:
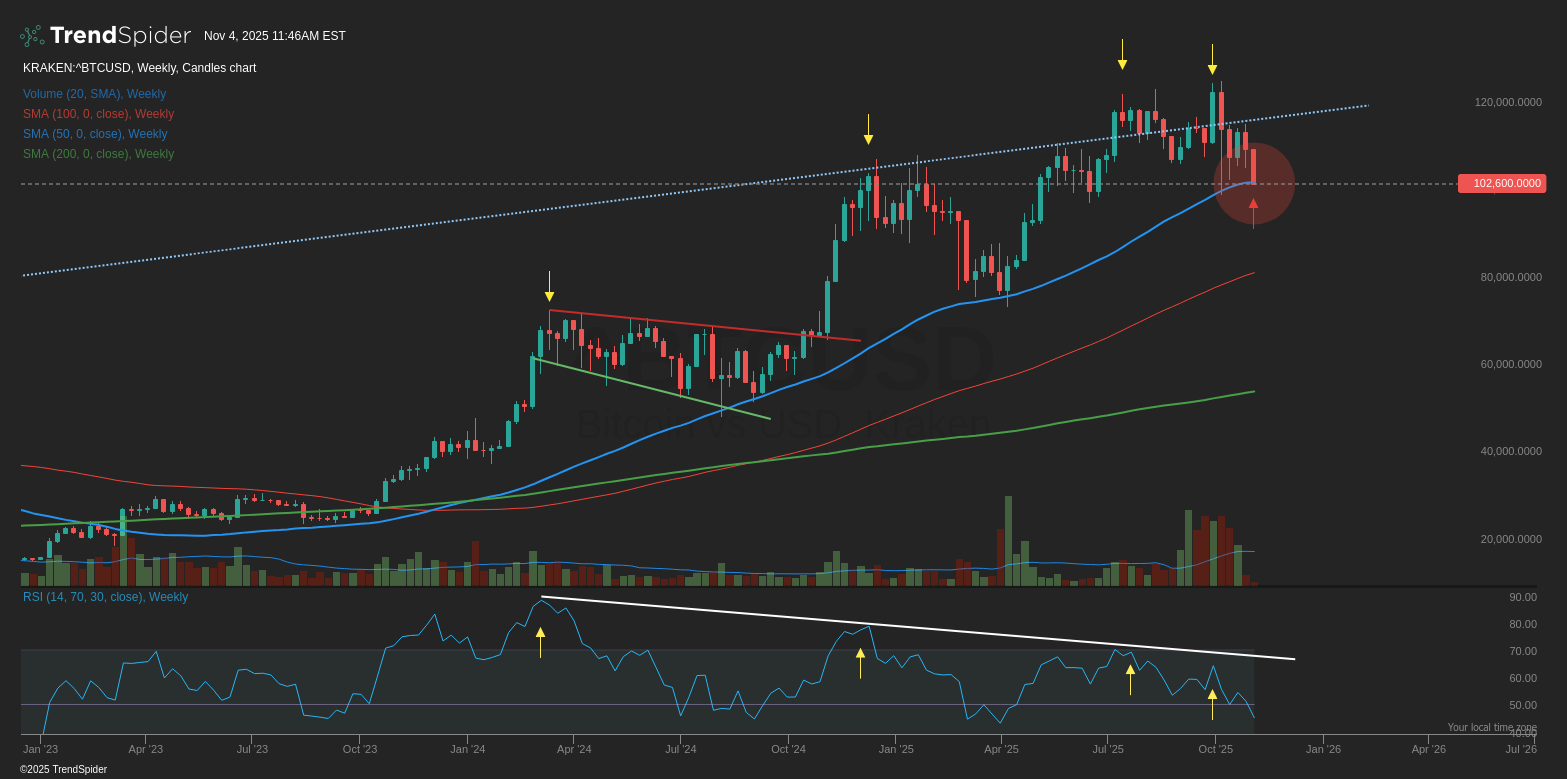
This is the current Bitcoin bull cycle through the weekly chart. As of writing, the price of BTC is roughly $102k per coin. Not only is this below the 50 week MA by a few hundred dollars, but it comes after a fresh all time high price and no less than 3 bearish RSI divergences from new highs dating back to December of last year.
From where I sit, it is imperative that bulls defend this $103k level this week. Failure to do so could see BTC down to the 100 week MA (roughly $82k currently) as soon as this year. And again, when we see BTC behave the way it is behaving currently, it has been indicative of a larger, sustained pullback down to the 200 week moving average.
To be sure, the next time BTC touches its 200 week MA, I suspect that MA will be higher than it is today ($55k). Perhaps $65k? Maybe $70k? We don’t know. But the last time BTC fell below its 50 week MA on a weekly closing candle this close to a fresh all time high print, it was 70% lower 12 months later:
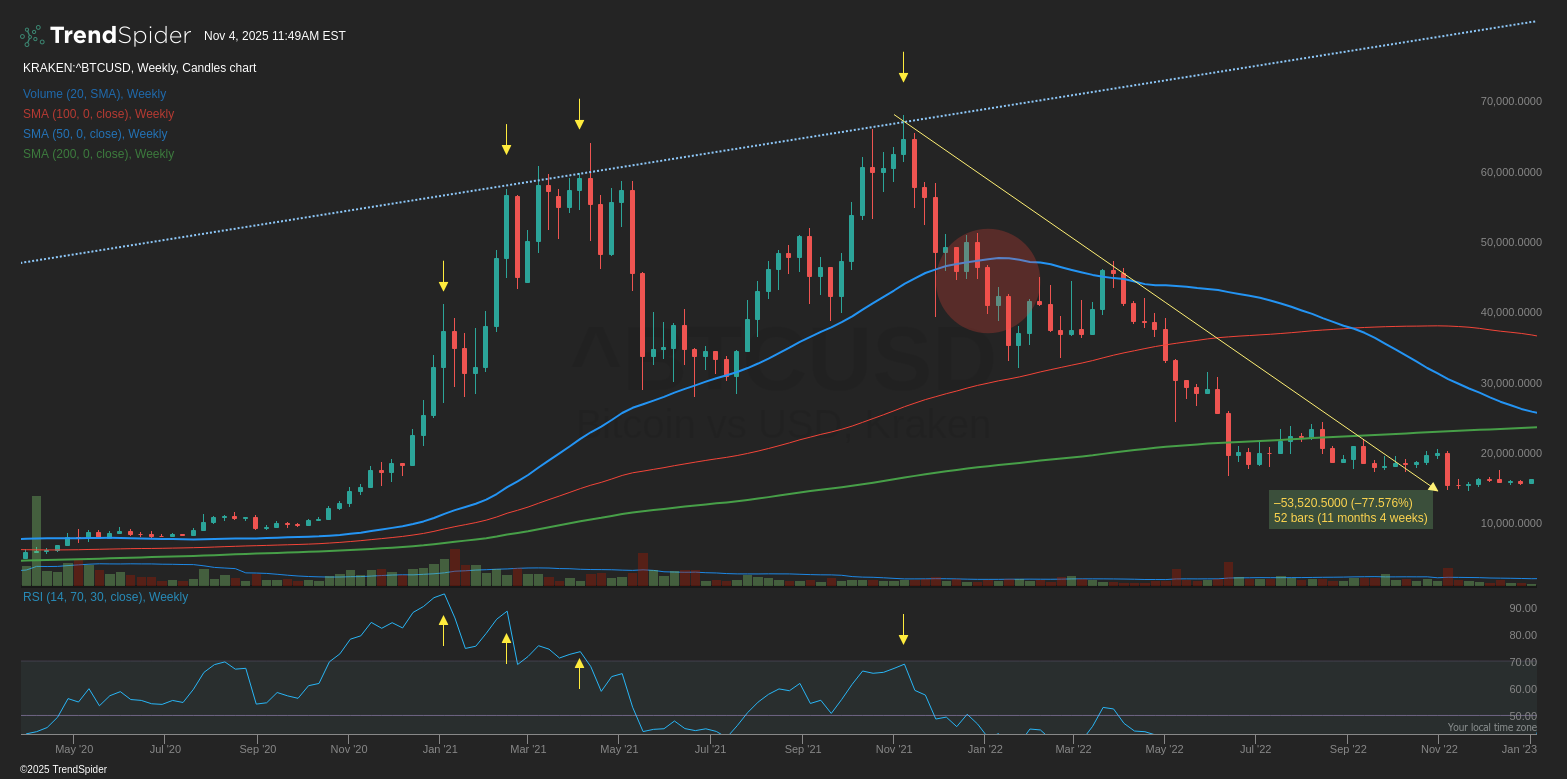
This was shortly after the top from the 2020 halving cycle. Our red circle above highlights when BTC convincingly gave up the 50 week MA. It quickly tested the 100 week MA, enjoyed a small relief rally, and fell all the way down to the 200 week MA (and lower) during what became yet another clear ‘crypto winter.’ We have to also acknowledge the additional similarities in RSI divergences expressed with yellow arrows. I count no less than 3 such instances between February and November 2021. And this aligns quite well with the timing on the three that I highlighted above for the current cycle between December 2024 and September 2025.
Now consider the longer term chart, the monthly:
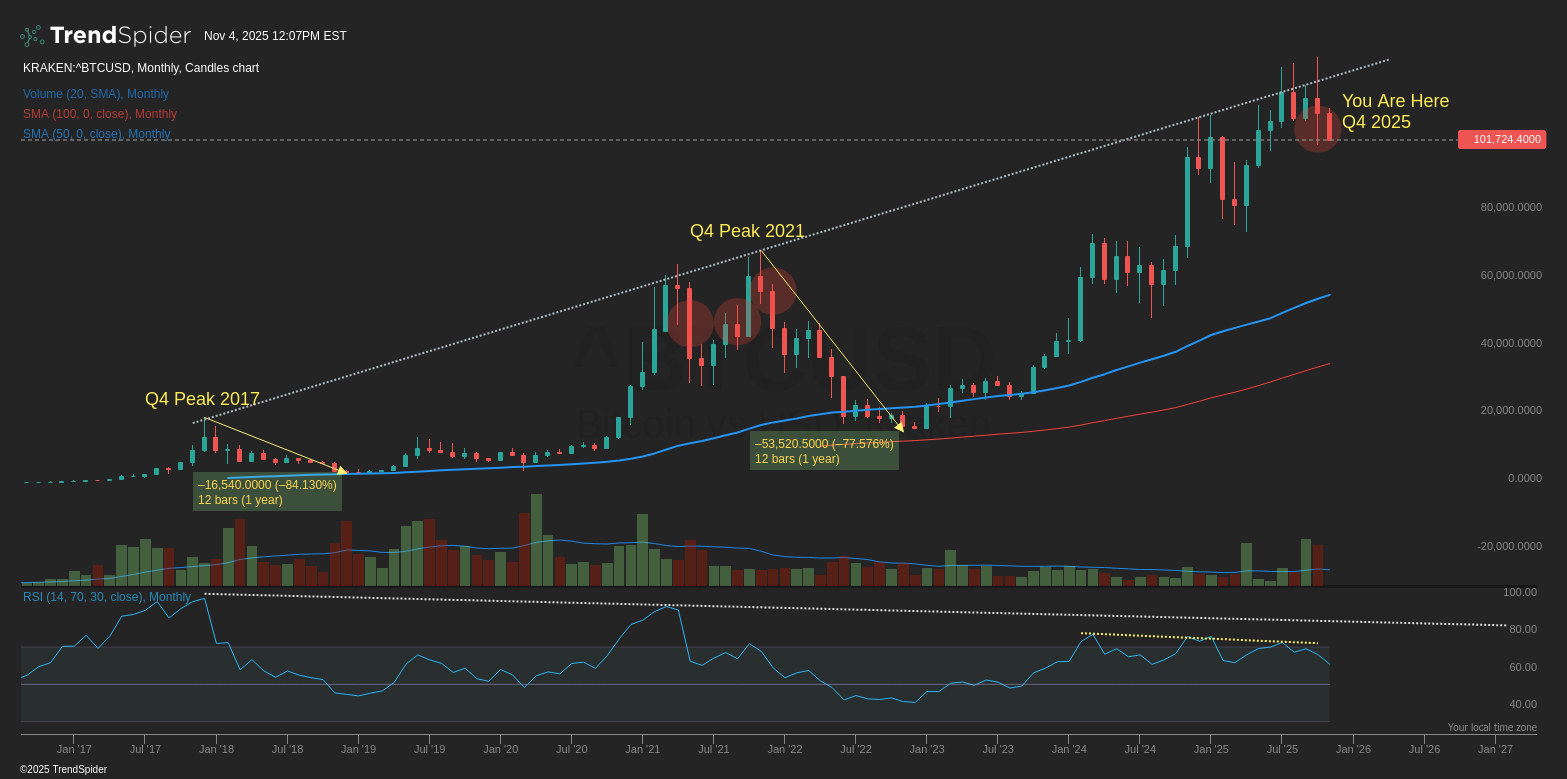
I’ve shared this a few times in the past and that linear top trend line continues to hold. Not only that, but it’s coming in conjunction with yet another massive set of RSI divergences cycle to cycle. Essentially, long term momentum is breaking down.
While technicals are a great way to interpret sentiment, fundamentals do ultimately matter and Bitcoin’s performance is entirely tied to capital flows. Thus, companies like (Micro)Strategy and ETFs are incredibly important - this is especially true due to the ease with which these entities can reverse flows if they need to.
Checking In On The Strategy Flywheel
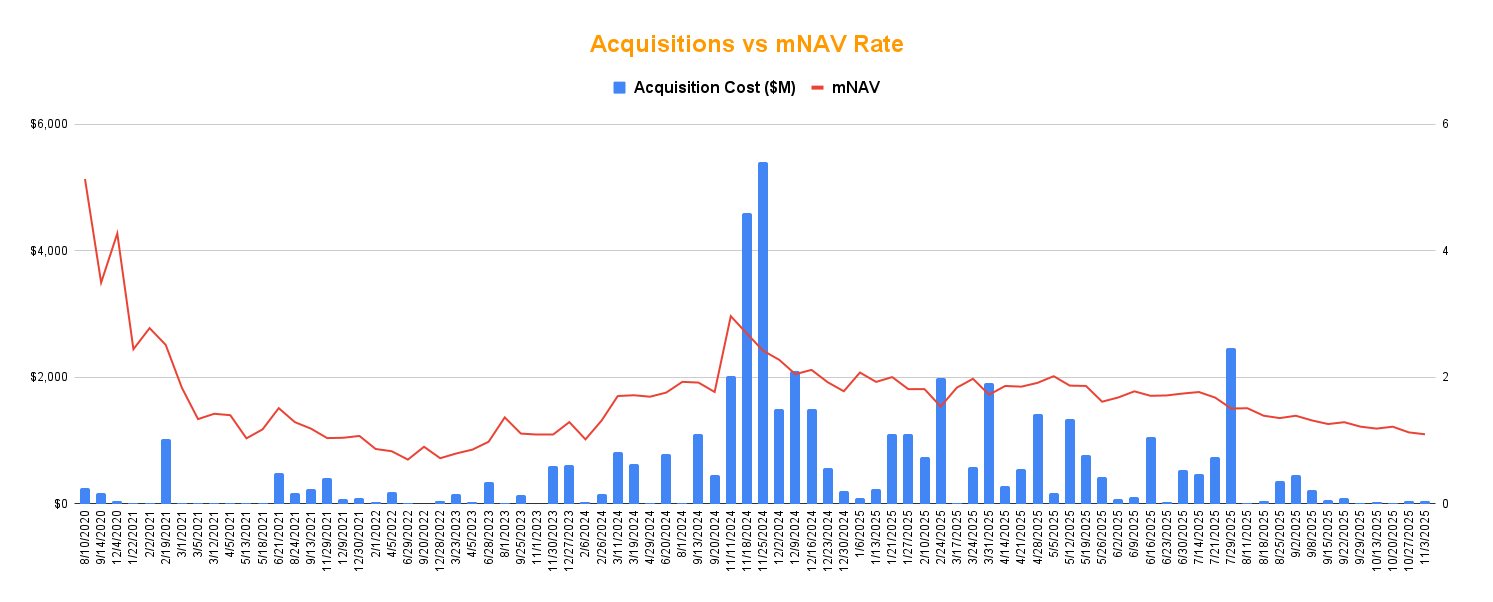
Yesterday, Strategy announced yet another week of Bitcoin buys. The latest of which totaled just $46 million. After buying over $3.6 billion BTC in July, Strategy managed to acquire just $1.4 billion combined between August and October. But again, it isn’t just that Strategy has drastically cut back on purchases in recent months, it’s also how the company is raising capital:
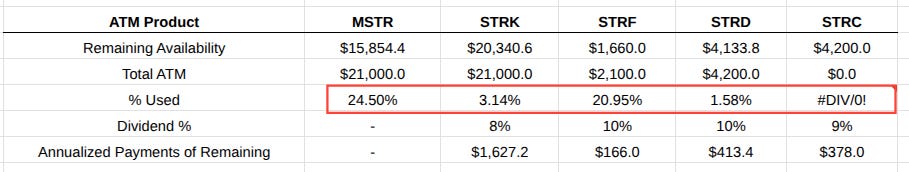
With the exception of STRF - which has a far smaller ATM than all of Strategy’s other preferred class stocks - the company has been almost entirely reliant on diluting MSTR common shareholders to buy BTC even since the preferred stock ATMs began. MSTR dilution accounts for 88.5% of Strategy’s ATM usage since March. And that common stock dilution will almost certainly have to come to an end very soon because Strategy’s mNAV premium continues to vanish:
Strategy’s basic mNAV is down to just 1.1. At 69, MSTR implied volatility is well below highs. Retail trader interest has fallen off a cliff - we can see that both in the TrendSpider data as well as anecdotally through a simple gauge like comments on MSTR articles through a platform like Seeking Alpha where articles that used to get 60 or 70 comments are now getting 10 or 20. The point is, retail interest in MSTR is languishing. And we can’t really blame them when they’re being diluted so Strategy can pay its preferred stock dividends.
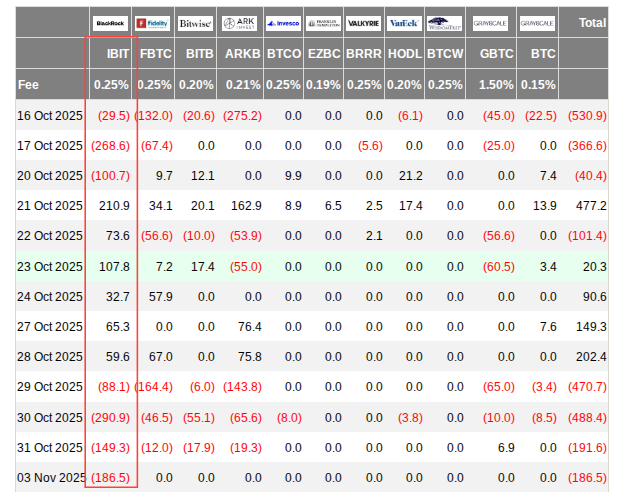
The mNAV premium is all but gone. Strategy can’t raise capital through preferred stock ATMs without jeopardizing a collateralization ratio that has already fallen from more than 500% to about 400% very quickly. It doesn’t help that all of the sharks in the water know where the pain points are. The immediate risk isn’t necessarily that Strategy starts selling down its BTC stack and reverses its own flywheel, it’s that a meaningful number of iShares Bitcoin Trust IBIT 0.00%↑ shareholders start front-running the reality that Strategy will almost certainly have to do so at some point in the future:
Finally, the same guys who are telling you today that Bitcoin cycle theory is dead will swear up and down that Bitcoin’s next block reward halving matters in 2028. Both cannot be true.
As always, I’m sharing these market moves as I see them. You certainly don’t have to agree. Perhaps $103k BTC this week will be a big ‘buy the dip’ opportunity. I’m not personally convinced of that, but I could certainly be wrong. Read work from bulls. Read work from bears. And then trust your own judgement.
Disclaimer: I’m not an investment advisor. I give my own opinions and share what I personally do. As of email/posting, I’m personally long ZEC-USD, BTC-USD, FBTC 0.00%↑ , MSTZ 0.00%↑ , and STRF 0.00%↑ .