

Portfolio Update: 10/12/22
Portfolio Update: 10/12/22
A little bit of everything in this one. Stonks, alts, and a tiny lady with a mushroom people haircut.

While most of my positioning has been fairly defensive over the last couple months, I have redeployed some cash that was on the sidelines into some familiar names - and some less familiar. I also have to provide yet another update on the alternative assets front. Another of my top 5 holdings got an exit. Also, the asset migration from Otis to Public.com has happened and the first few days of trading on that platform were a friggin’ rollercoaster ride. Finally, I’ll share some things that I don’t like about Public and some that I do like now that the Otis migration is complete.
If you remember my last real portfolio update in mid-August, I was talking about some sells I had made in the equity account. Those sells were Roku ROKU 0.00%↑ , Target TGT 0.00%↑ , Camping World CWH 0.00%↑ , and a Chicken Soup rotation from common shares CSSE 0.00%↑ to debt notes (CSSEP). The S&P 500 was at 4,235 at the time. Here’s how those tickers have done since I raised cash:
Roku was $83.81, now $53.06 (down 37%)
Target was $172.48, now $154.16 (down 10%)
Camping World was $31.81 , now $27.79 (down 13%)
Chicken Soup was $12.21 , now $6.25 (down 49%)
S&P 500 was 4,235 , now 3,577 (down 16%)
Before you congratulate me, I’ve had some poop calls since mid-August as well. Like when I started buying Roku again a little over a week ago in the high $50’s and it immediately went down another 10%. Yeah. I hate Roku. Officially. Worst stock ever. *cough sentiment check* Or when I pondered if it was time to go Risk On in mid-September right before the CPI came in a millimeter hotter than expected and the market responded by wetting the bed. The post title had a question mark. That’s called a hedge, folks. Doesn’t count!

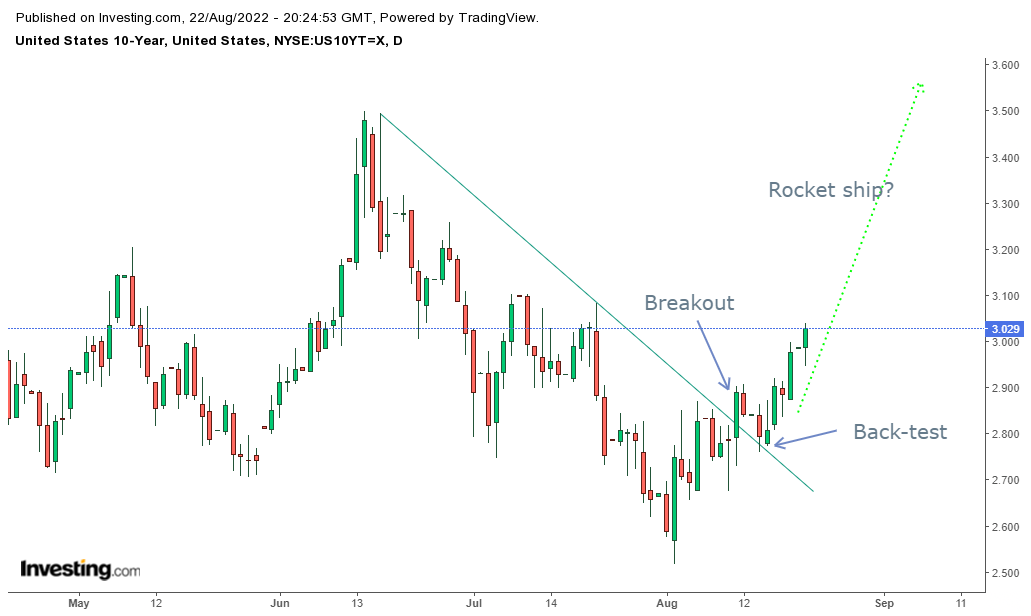
Actually, the best call I’ve probably had in the last few weeks was the 10 year. You guys remember this?
Here’s how it looks now:
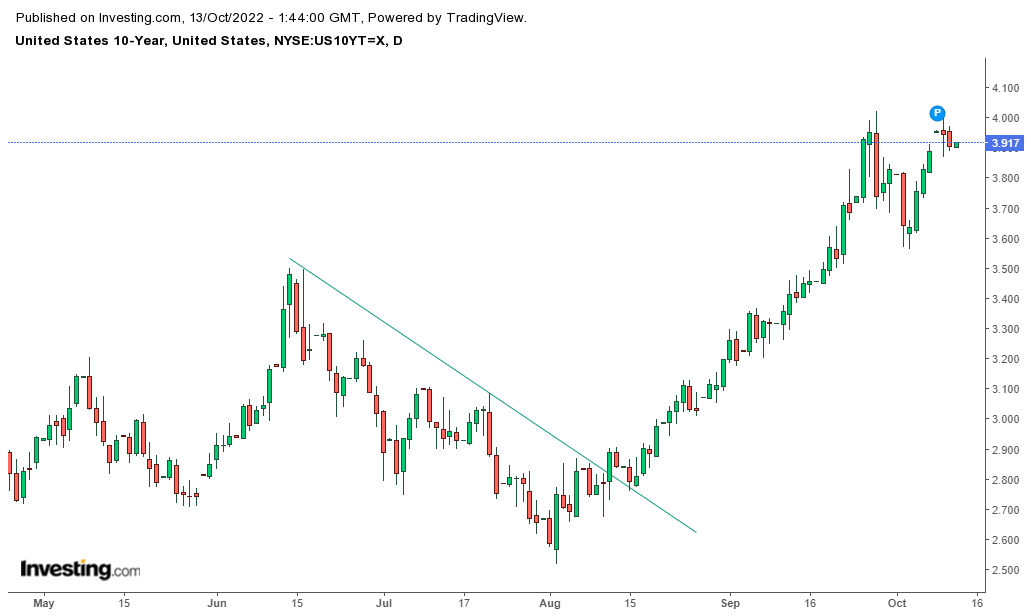
I mean, I thought yields would go up but even I’m surprised by how ridiculously close the 10 year was to tracking the rocket ship line I drew in late August. But it needs to be repeated; this chart is telling us that bonds are collapsing. How much longer can the central bank allow this to continue before the powers that be start to get jittery. Maybe it’s already happening. You know who is worried about treasuries?
Keep reading with a 7-day free trial
Subscribe to Heretic Speculator to keep reading this post and get 7 days of free access to the full post archives.