


Bitcoin Beatdown: Will It Be "Christmas in July" For BTC Bulls?
The crypto thrashing continues. Fund flow data and address metrics I'm watching for BTC. Plus, the level where I'm a big buyer.

Yes, I was largely unplugged for nearly 10 days. I actually think this worked out in my favor to be honest. While it’s tough to see some of my equities down big and certainly the wreckage in Bitcoin and the altcoins, vacation likely saved me from some bad buys. For instance, I bought a chunk of Bitcoin at $61k this morning. I would have probably purchased that same chunk at $66k a few days ago if I was sitting in my pajamas in front of a computer at home like I usually am.
But enough about me!
While I have quite a bit to say about altcoins (more on those later this week) we’re going to focus entirely on BTC today. In this post, we’ll look at Bitcoin price charts and some key data that I think is foreshadowing a lower low coming in everyone’s favorite digital asset. If you missed the thread this morning, you can participate in that here:
I’ve opened it to all subscribers this week rather than just the paid subs like I typically do. And if you like the content that you find in there, now is a good time to go paid and become a “full heretic.” Also, most of you are monthly subs. This is a great opportunity to lock in a great rate with a yearly commitment.
25% off an annual will actually save you 37.5% on monthly subscriptions over the long haul. Deal ends July 4th. Okay, I’m done schilling…
Bitcoin Beatdown
To today’s intraday low, Bitcoin is down nearly 18% from it’s intraday high on June 7th. We are damn near in what traditional investors would call a “bear market” in a little over 2 weeks. If you were “all in” already, this hurts. And this is why I preach always having dry powder when we get selloffs like this. I have a very hard time buying highs. I’d much rather buy dips after the highs. And that’s what we have right now. Well, actually… this is really more of a knife than a dip…
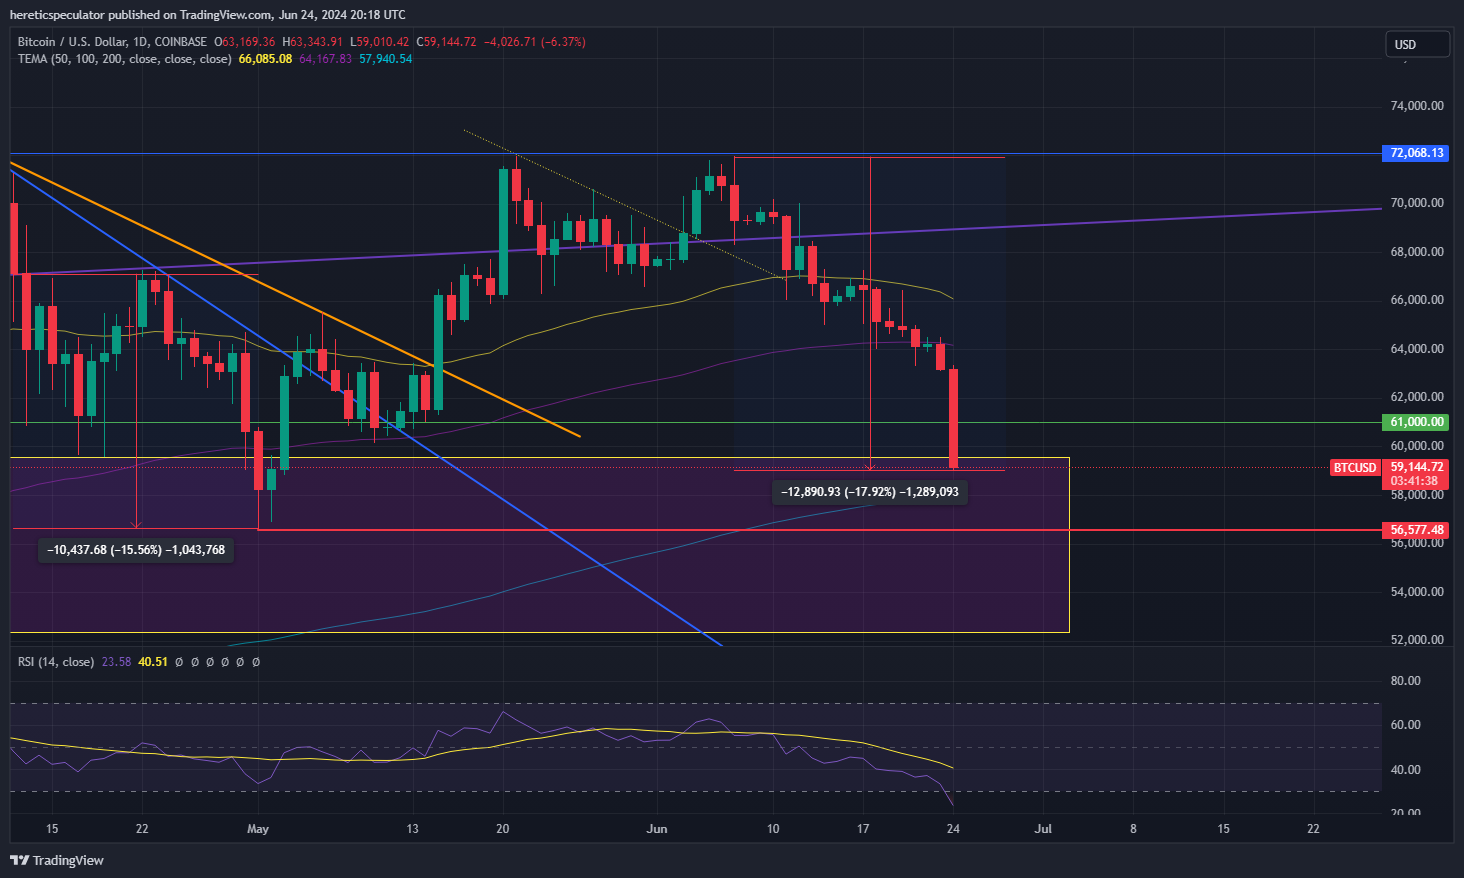
Before we go too much further into fundamentals or longer term charts, we have to talk about my purple box.
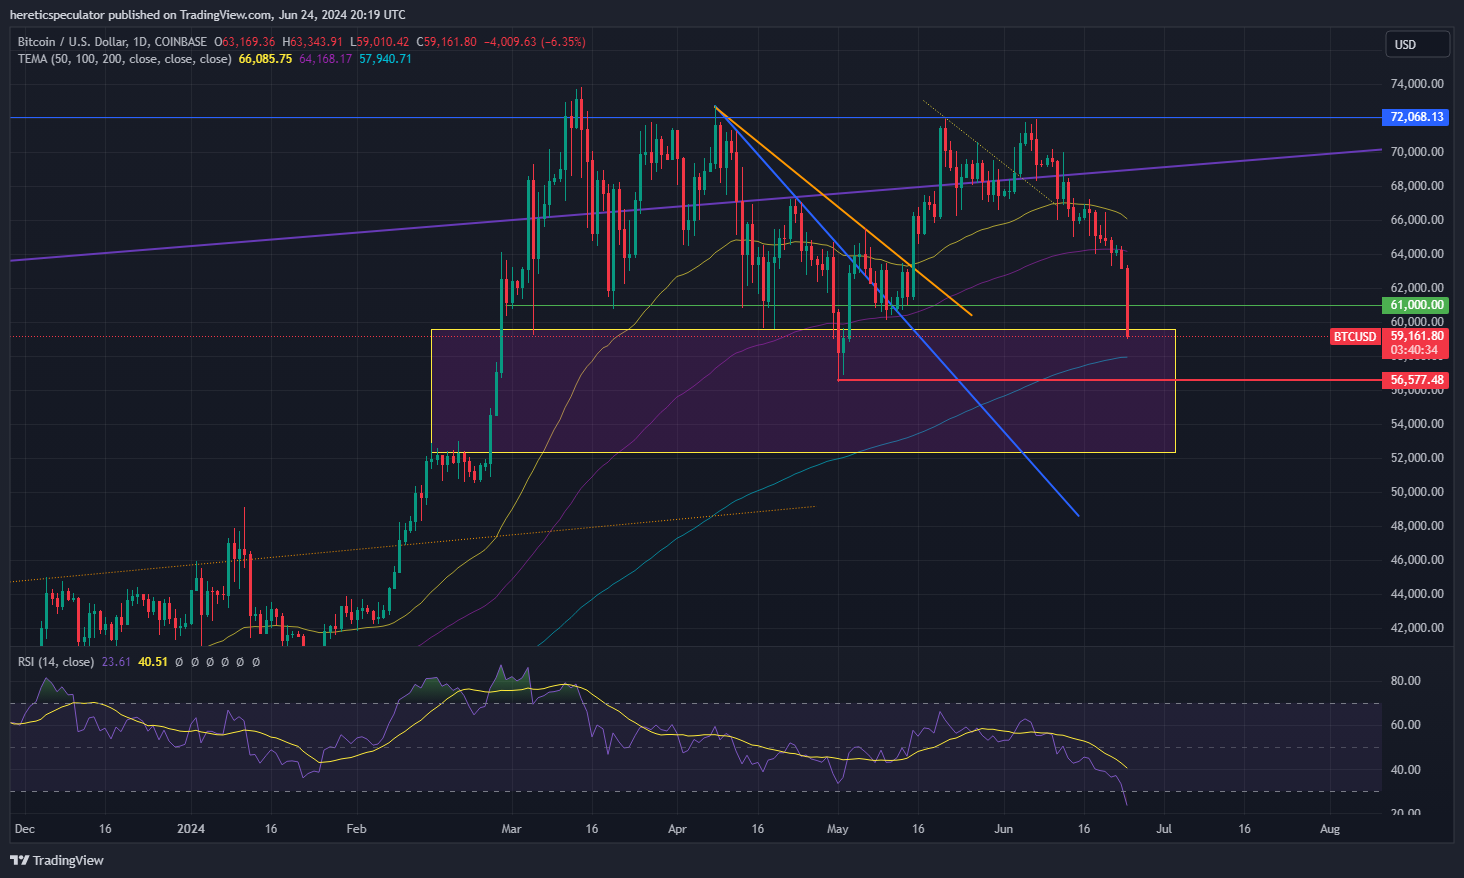
I’ve had this box in this chart for months. Reason? We have a $10,000 pocket of virtually no real price discovery in this coin from late February. You can see in the chart above that BTC went from $51.7k on February 25th to $62.5k just three days later. With the exception of a two day period in early-May, we have almost no trading time in this purple box. Not only do I think we’re going back into it, but I think we may go back to the bottom of it.

Seriously though. What have I stressed about Bitcoin for literally months?

If we’re buying Bitcoin strictly on fundamentals, we’re overpaying. This has been a number go up game for a long time and as speculators we need to be prepared for the possibility that Bitcoin may go down.
According to data from CoinShares, $630 million of investment capital came out of Bitcoin last week - $544 million of which was from US-based ETFs alone. It’s the second consecutive week with over $600 million of net outflow from Bitcoin investment products.
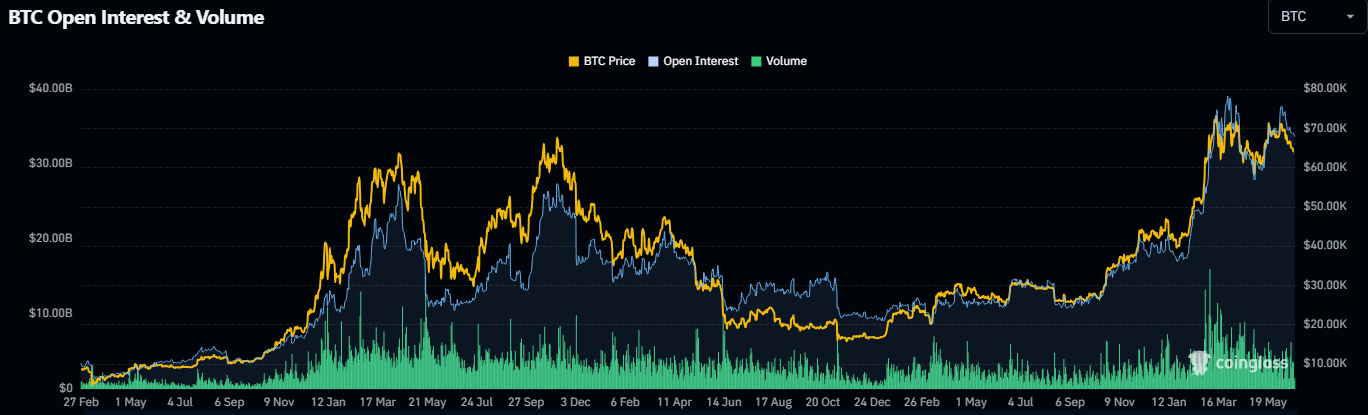
There’s been over $154 million in BTC longs liquidated in the last 24 hours according to CoinGlass.

This makes the last day the worst day for Bitcoin bulls from an aggregate liquidation standpoint since April 12th. The bad news for bulls is that April 12th liquidation event preceded another 15% decline through the rest of the month. Of course, this does not mean it has to happen again the same way. But I suspect we’ll see additional declines because Bitcoin is a capital flow asset and right now the capital is leaving if US ETF investors are an indication.

Furthermore, there is a lot of BTC that could still move if those same ETF investors get nervous and keep selling. Consider the chart above and notice the massive gray bubble in this break even price chart. The range of those 6 million wallet addresses goes from $46.6k to $63.1k and the average price paid is $54.9k. This is essentially another way of looking at the “purple box” from my daily chart. There was very little price discovery in that range at the end of February and these addresses probably need to feel the pain a bit before we have a real bottom. That means lower prices. Maybe even under $50k - though I’m not banking on that.
Fundamentals and Valuation
I’ve made this point ad nauseum, without users, you don’t get fees. Without fees, miners lose incentive to secure the network. That last point hasn’t mattered much yet. But the byproduct of a collapsing user base on the network and the fee market destruction is the overvaluation of the network if the coin price doesn’t correct. And to this point, BTC’s price correction has been avoided due to investor demand through ETFs. Result? The most astronomical 30 day average NVT ratio for Bitcoin since 2010:
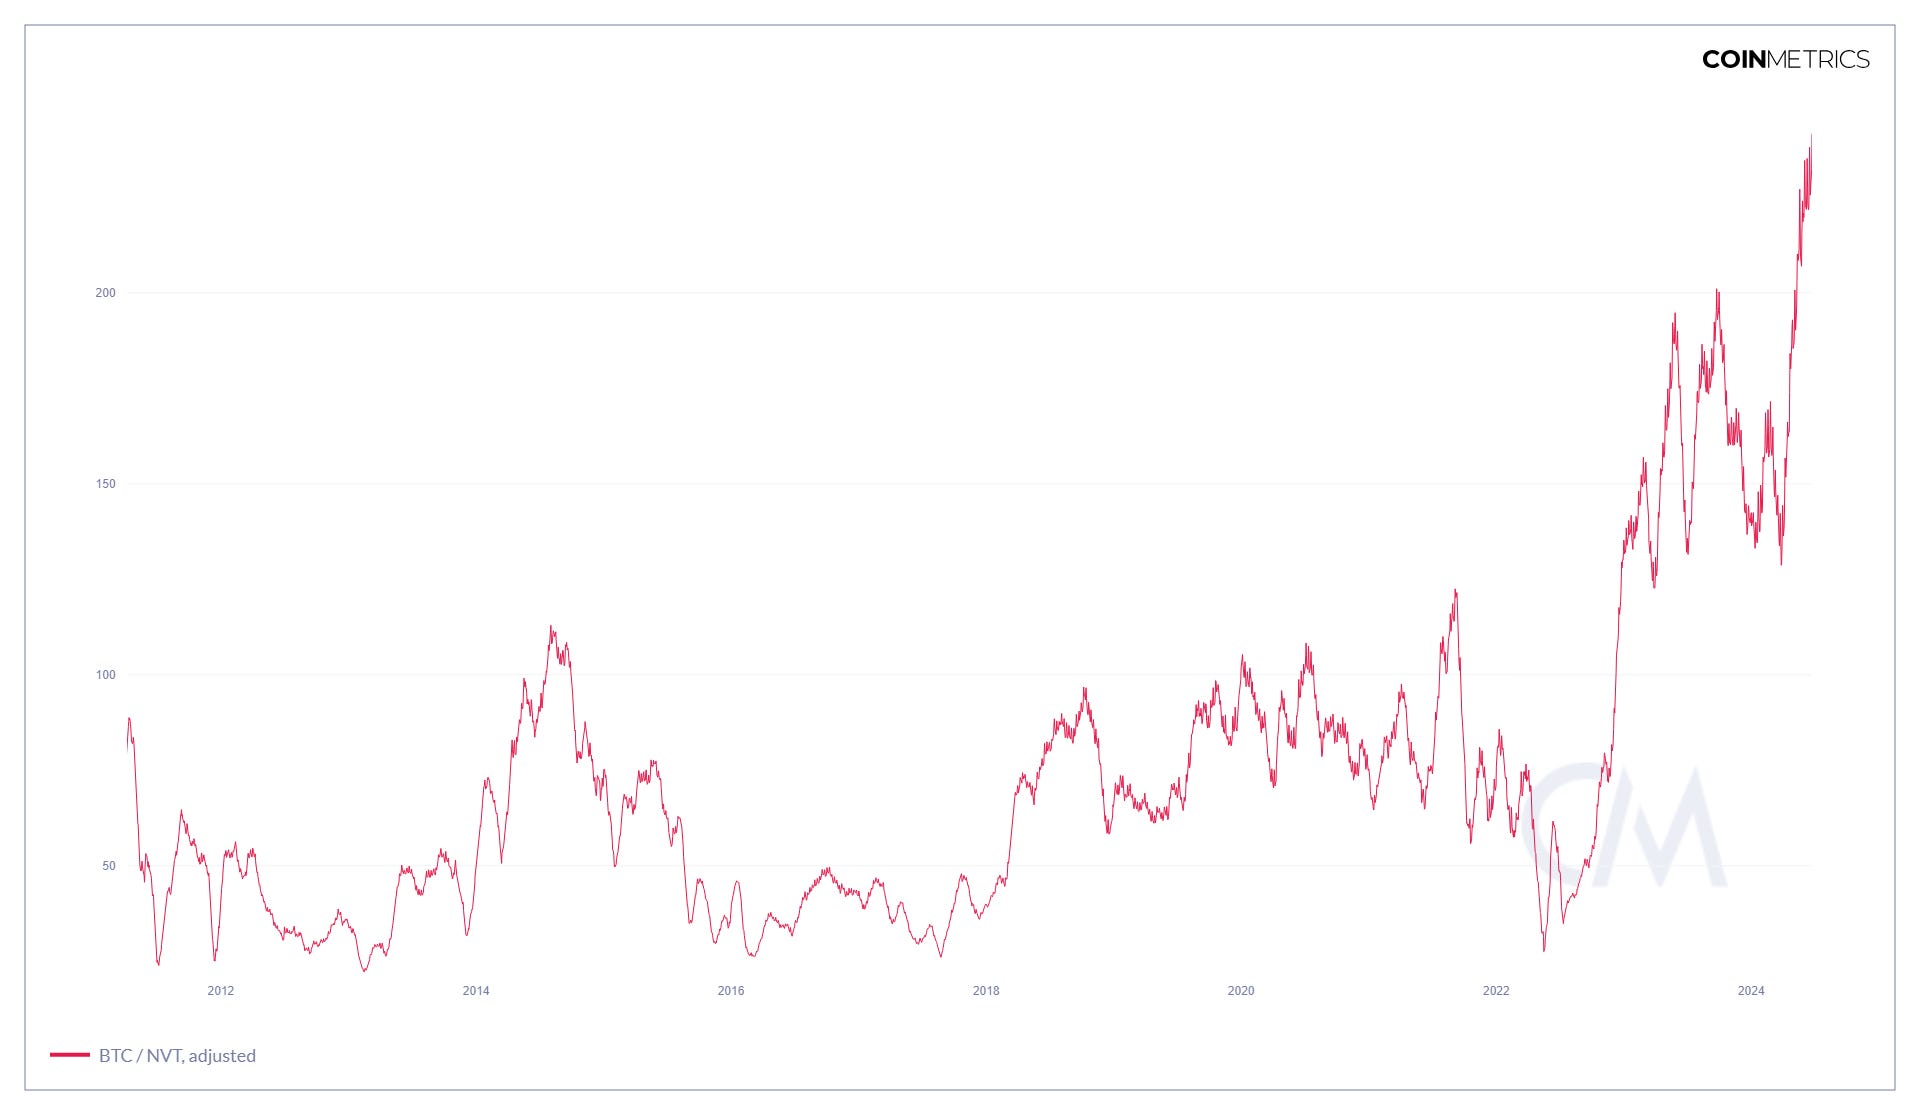
Like literally Bitcoin is more expensive on a net value to transactions ratio now than it was 6 months after “Pizza Day.”
When Will the Bloodbath End?
I don’t know. Sorry. Best we can do here is guess. But I think the purple box is a good indicator. As are moving averages on the weekly chart. My personal barometers are the 8 and 20 week MAs. And the story there is a bad one:
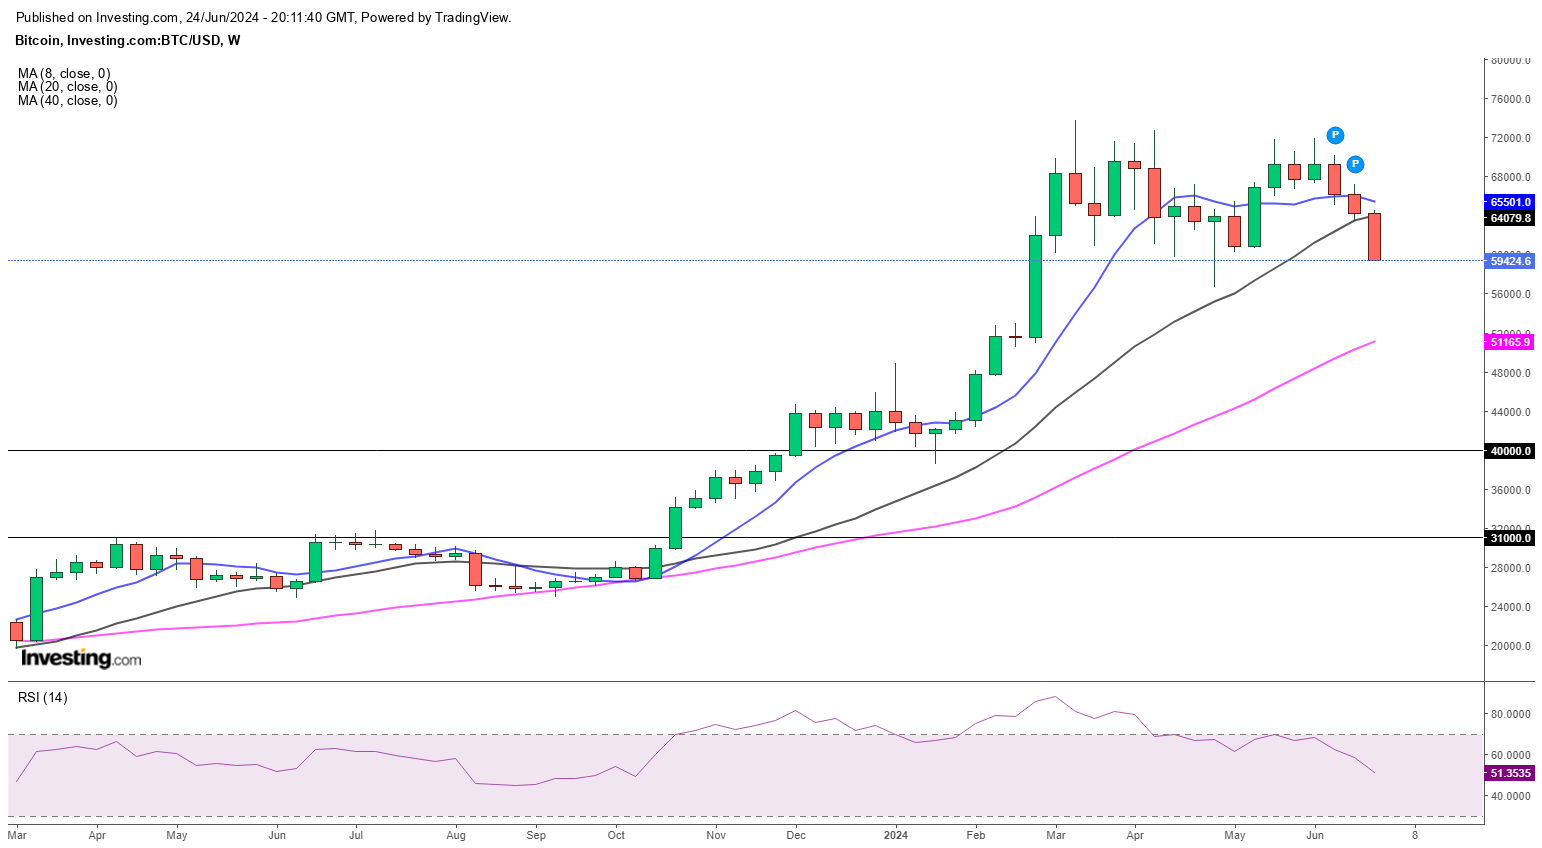
Not only has BTC given up the 20 week MA decisively, but the 8 week is now threatening a cross below. The last time this happened, the 40 week turned into support. That level is currently $51.1k. Which would be in-line with the bottom of our purple box. I plan to buy small chunks all the way down before buying a bigger bag at that $51k level. It may not get there. It may get there and continue sliding lower. For what it’s worth, this is how I’m seeing it, what I’m watching, and what I’m planning to do.
It’s good to be back. I missed you guys :)
Disclaimer: I’m not an investment advisor. I trade stocks and shitcoins in my pajamas. I’m long BTC.